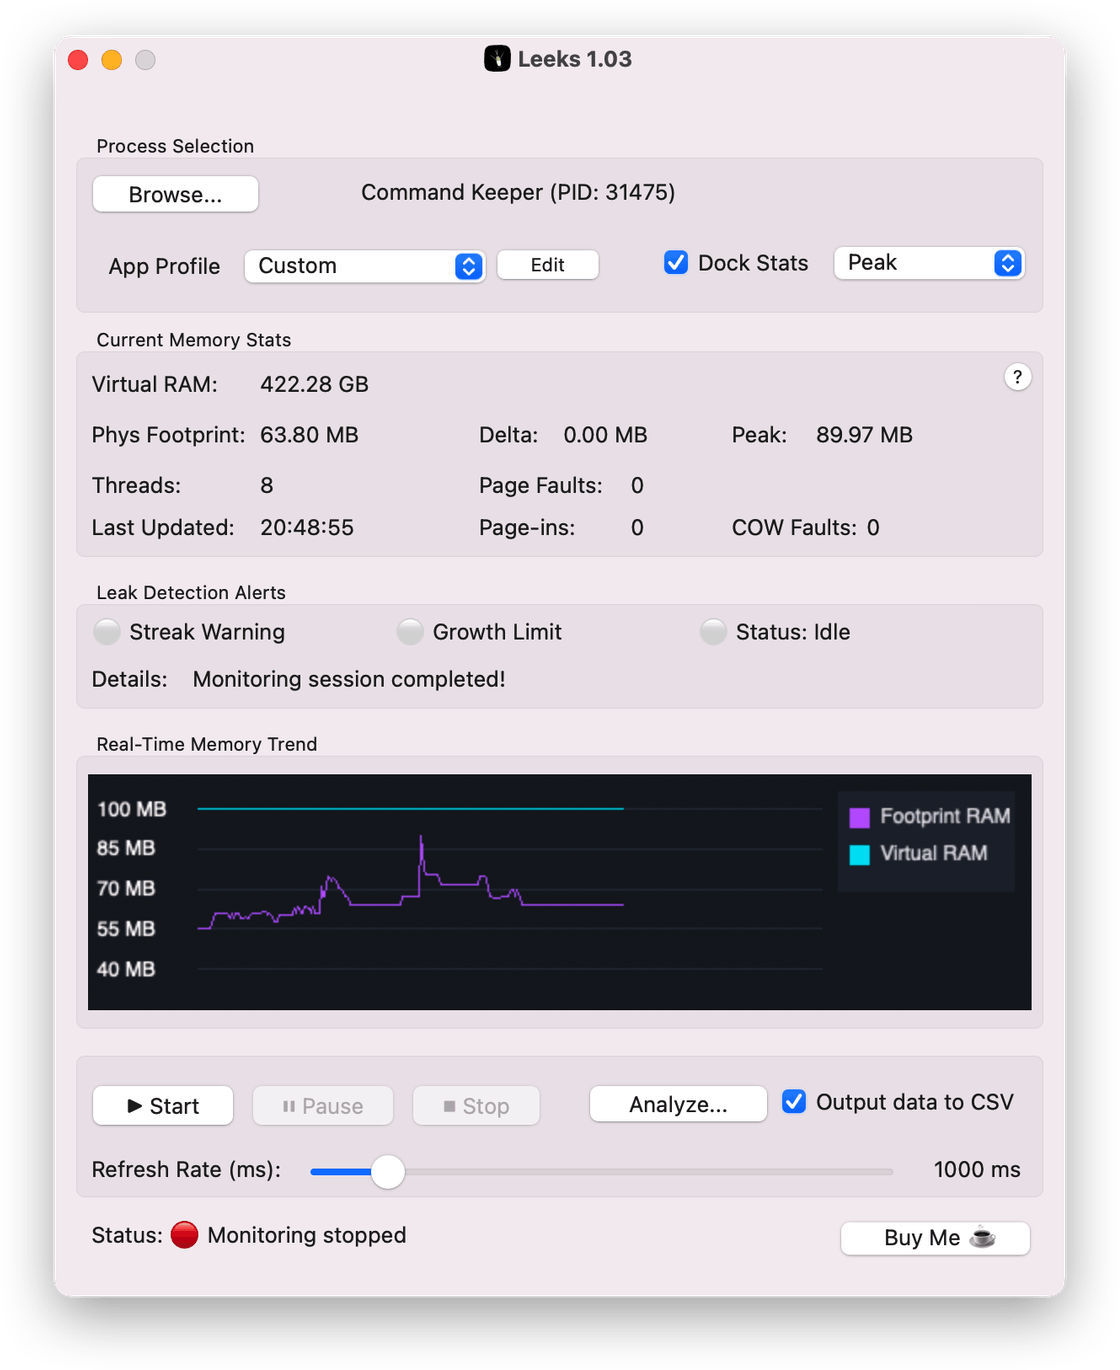
Catch Memory Leaks
Memory leaks can slow down or even crash your Mac over time; stop guessing where your app's RAM is going. Leeks provides real-time, low-level macOS process profiling to track an app's physical memory footprint
Reports Results Clearly
Translates raw memory numbers into a clear, report that automatically filters out normal noise and highlights potential trouble spots
Save and Compare Memory Logs
Export monitoring sessions to CSV files to track memory improvements over time or review memory trends across different app updates
Zero Bloat
Runs silently in the background with virtually zero CPU impact
Leeks in Action
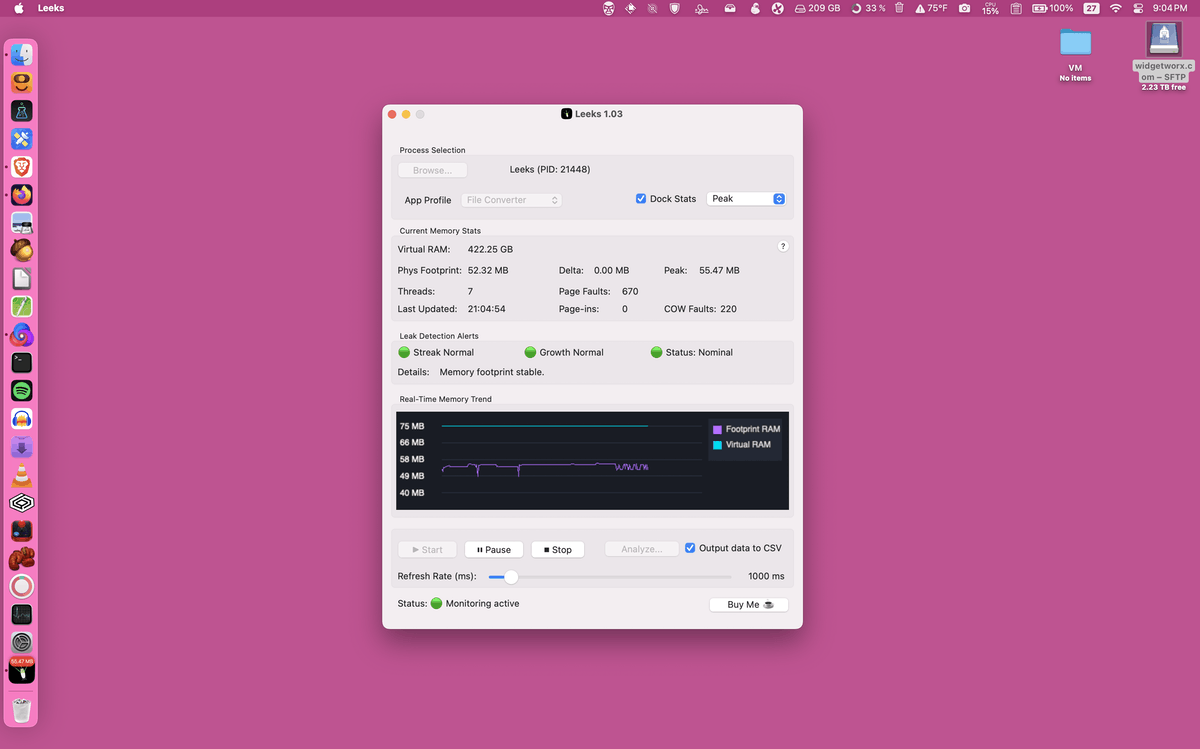
Track memory usage in real-time
Track true physical RAM usage in real-time with zero-overhead
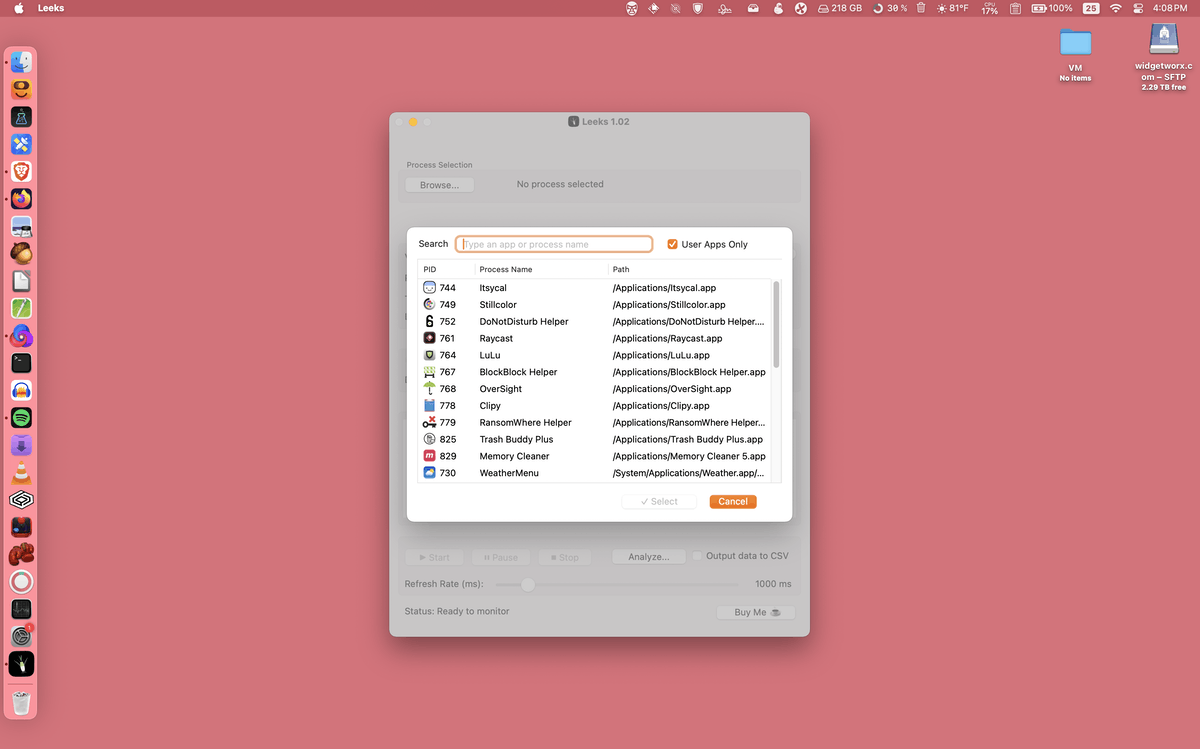
Analyze processes from the command line
Leeks comes bundled with leeks_cli, so you monitor apps for memory leaks directly from a Terminal
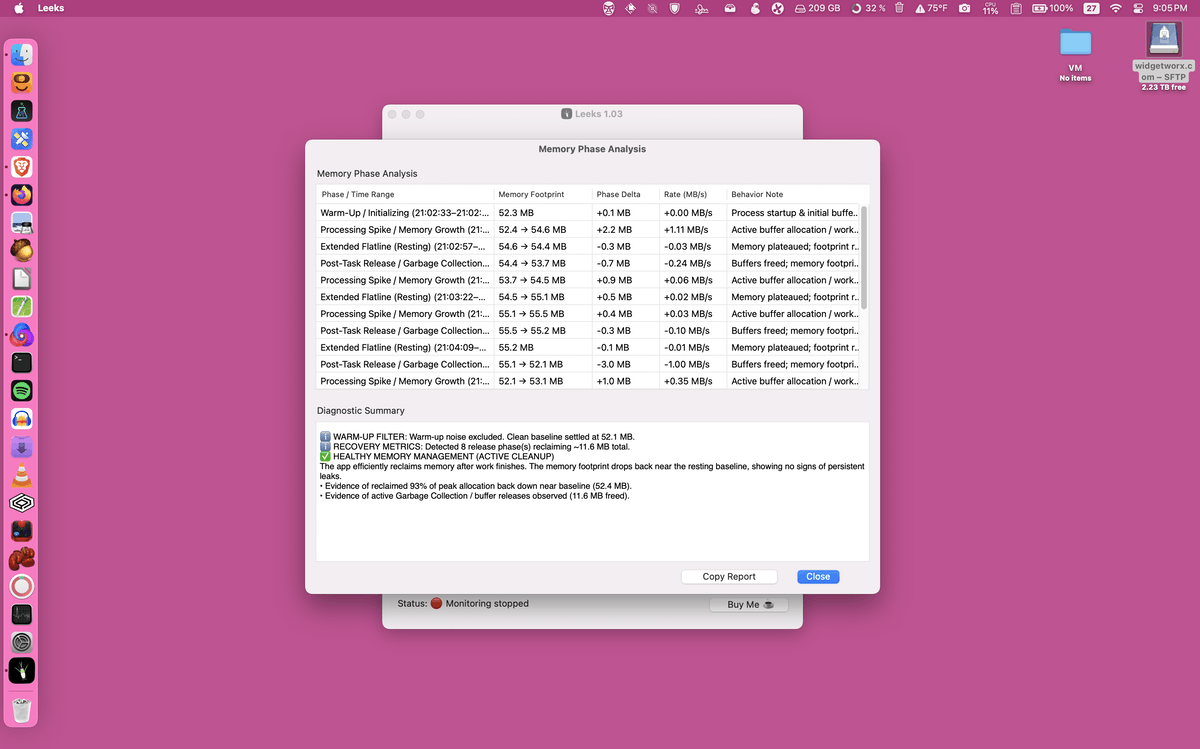
Get clear insights on app leaks
Get diagnostic reports that help isolate progressive "stair-step" memory leaks
How Leeks Compares
| Feature / Advantage | Leeks | Activity Monitor | Xcode Dev Tools |
|---|---|---|---|
| Core Focus & Audience | Lightweight memory diagnostics for vibe coders & power users | General system-wide process monitoring | Deep developer profiling & memory graph debugging |
| Setup & Workflow Complexity | Instant with customizable configs | Pre-installed macOS utility | Requires Xcode, Instruments, or CLI setup |
| Memory Diagnostics | Smart RAM analysis & leak tracking | Basic real-time process memory footprint | Full heap stack analysis & object allocation tracking |
| Resource Overhead | Low system impact | Low system impact | Heavy IDE overhead & diagnostic tracing load |
| Pricing | Free Donation-supported | Free (Built-in) | Free with Xcode / macOS SDKs |